Daily internet and social-media time across the Five Eyes
- Observations
- 60 2 indicators × 5 countries × 6 years
- Missing
- 0 within the governed panel
- Derived values
- 5 2023 social-media estimates
- Population
- Internet users aged 16–64 not the full population
Loading the governed context insight…
Marker rule: diamonds identify transparently derived 2023 social-media values. The chart does not join observations across the documented 2023→2024 reporting-method boundary.
View accessible figure data
View represented sources
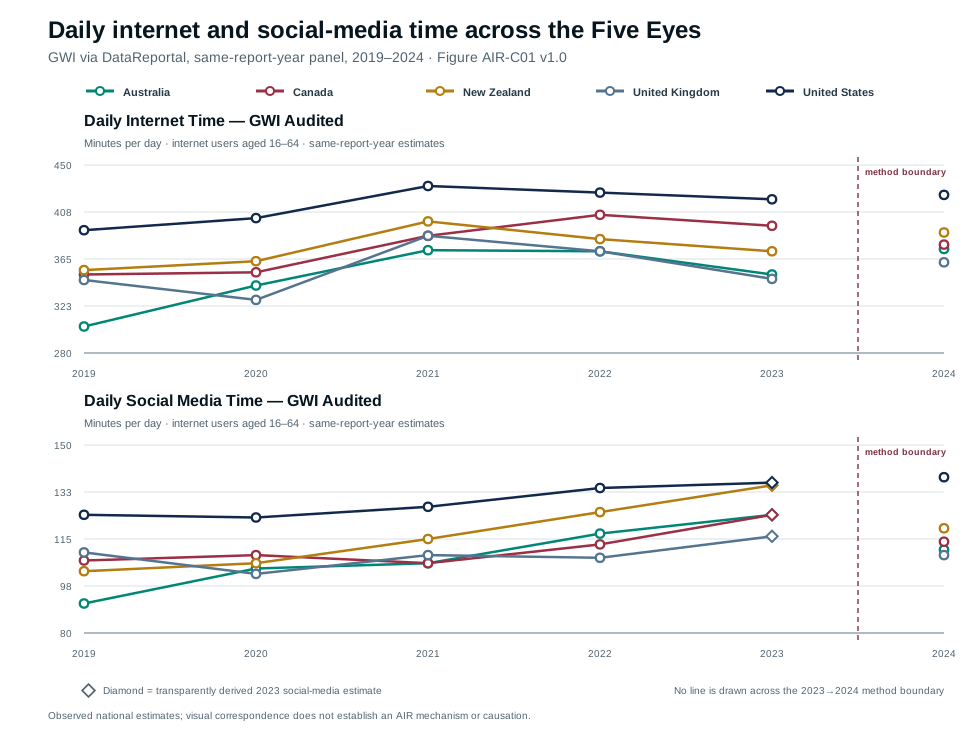
The public release contains a complete 2019–2024 panel of 60 country-year-indicator observations. Within each same-report-year comparison, the United States has the highest estimate for both daily internet time and daily social-media time. This is a bounded descriptive finding, not a general population ranking.
The panel establishes that intensive digital use is a measurable feature of the recent Five Eyes context and that estimates differ between countries and years. It supplies contextual evidence for AIR questions; it does not measure an individual pathway or an algorithmic effect.
Differences could reflect digital infrastructure, work and leisure practices, platform habits, pandemic-period behaviour and other country-specific conditions. The figure does not adjudicate between these possibilities.
Some apparent differences may arise from sampling variability, survey and reporting choices, the defined internet-user population, the five derived 2023 social-media values or the reporting-method change before 2024.
It does not show that more time online caused radicalisation, violence, loneliness or any case outcome. It does not reveal content, recommendation exposure, platform, motive or the experience of any offender or victim.
The figure supplies one context layer for the proposed AIR Framework. Its use is governed by the ecological and non-causal rules in the AIR methodology; it is not empirical validation of AIR.
Hollewell and Longpré (2022) review the relationship between self-radicalisation and the internet, while Bonsaksen et al. (2023) illustrate that social-media associations can depend on motives and study design. Neither source validates national screen-time estimates as a causal proxy for AIR.
Values are estimates for internet users aged 16–64, not all residents. The five 2023 social-media values are derived, the 2024 values begin a documented reporting-method regime, and this visual does not display sampling uncertainty. No line is drawn across that boundary.
Can the country ordering and period patterns be replicated with independent harmonised sources? How sensitive are results to age, population weighting and uncertainty? Which research designs can measure content and recommendation exposure without treating national averages as individual causes?